PerfView is a very light profiler for production environments to help investigate issues related to memory or CPU for .NET applications. PerfView is definitely not for the average user (this comment is intended as motivation, not discouragement!); it’s very powerful, and having a solid understanding of how Garbage Collector works is a must in order to comprehend all the information PerfView provides.
PerfView can also collect information like network packets, File I/O and Registry access, among others. It uses Event Trace for Windows (ETW) technology, so the trace can be visualized by other tools.
At BitTitan, PerfView is probably the number 1 tool I use when investigating application issues.
In all my investigations, a problematic migration from Customer A may be happening at the same time as Customer B, C, D…. a dozen other migrations from other customers, so I need to be able to isolate issues to specific migrations.
Let me give you this real example: Using tools like PerfView and WinDbg when the migration was extremely low, I was able to isolate the problem caused by millions of “watermark” objects in memory which were causing a lot of pressure on the Garbage Collector.
The fact that this problem had happened several times gave us insight about the consequences of our application design related to watermarks. The beauty of these findings is that we can give this information to our Product Group, which we did. They rewrote parts of the application to fix the bottlenecks we found – part of our approach to continually improve our applications. In fact, our new version is not only less memory-intensive, but faster! And that translates to happier customers.
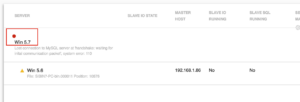
Tip: When I collect PerfView traces, I stop the collection when the trace size is about 400 MB to 450 MB, as seen in the Status field above. The tool shows you the size of the trace file on that Field, during the collection process. You might instead collect a trace file for one to two minutes. The logs are really big so you don’t want to run it for more than two minutes.
Tip 2: If you need a light .NET profiler that is super easy to install (so that you can analyze the duration time of methods without worrying about CPU time or memory), there is an old Microsoft profiler that can be helpful. It’s called NP .NET Profiler. It’s very easy-to-use but unfortunately was never updated.
Tip 3: Let’s suppose you collected a PerfView trace with File I/O. Using PerfView to analyze the trace, you can see I/O calls consuming more CPU and the call stack. But let’s suppose you need more than that, like a chart showing the I/O usage over time by a specific application. In this case you take the same trace and open it using WPA (Windows Performance Analyzer), which I discuss below.
Tip 4: Let’s suppose you collected a PerfView trace with network packets or more network information. PerfView is not the tool to analyze network packets, but you can analyze the same trace using Message Analyzer, which I discuss below.
Tip 5: If you have a situation where you need to analyze threads in wait state, you need to check the Thread Time check box. This option is not enabled by default.
Here are two great sources of information about this tool:
- Channel 9 videos where the author of the tool shows how to use PerfView in different scenarios
To summarize, PerfView is a very powerful profiler that can save the day!
Message Analyzer

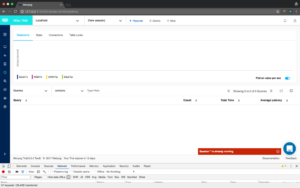
Message Analyzer replaces Network Monitor (NetMon), another Microsoft tool. Contrary to what you may think, Message Analyzer can be used for more than network analysis. In fact, you can open different files using this tool, like Event Logs and ETL traces among many other types.
You can use Regular Expressions during the analysis to match data fields (not that I think RegEx is fun).
When analyzing network issues there are some cool features, such as Pattern Match, which lets you to create and execute your own Pattern Expressions.
With Message Analyzer you can easily see trace data associated with a process. It’s possible because ETL trace contains process information. Also, Message Analyzer has Windows PowerShell cmdlets.
Tip: You can use Message Analyzer to visualize virtually any type of log. Just use the New Session -> Files option.
To learn more about Message Analyzer you can:
Windows Performance Analyzer

WPA is another ETL-based tool, and it is useful to troubleshoot application problems as well as operating system issues. It is so powerful that it can be used to analyze power issues as well.
Compared to PerfView, WPA has a lot of nice charts, allowing you to be very granular when analyzing information. For example, if you collect a trace using PerfView that includes disk I/O information, you can have a much better and more granular view of the I/O reading the same ETL trace via WPA.
Tip: WPR is the companion tool you need to collect ETL traces. Here is the interface:
Resources to learn more about WPA/WPR:
That’s it for now! Keep an eye out on our blog for part 3 released on February 9th of this Tips and Tools series.


