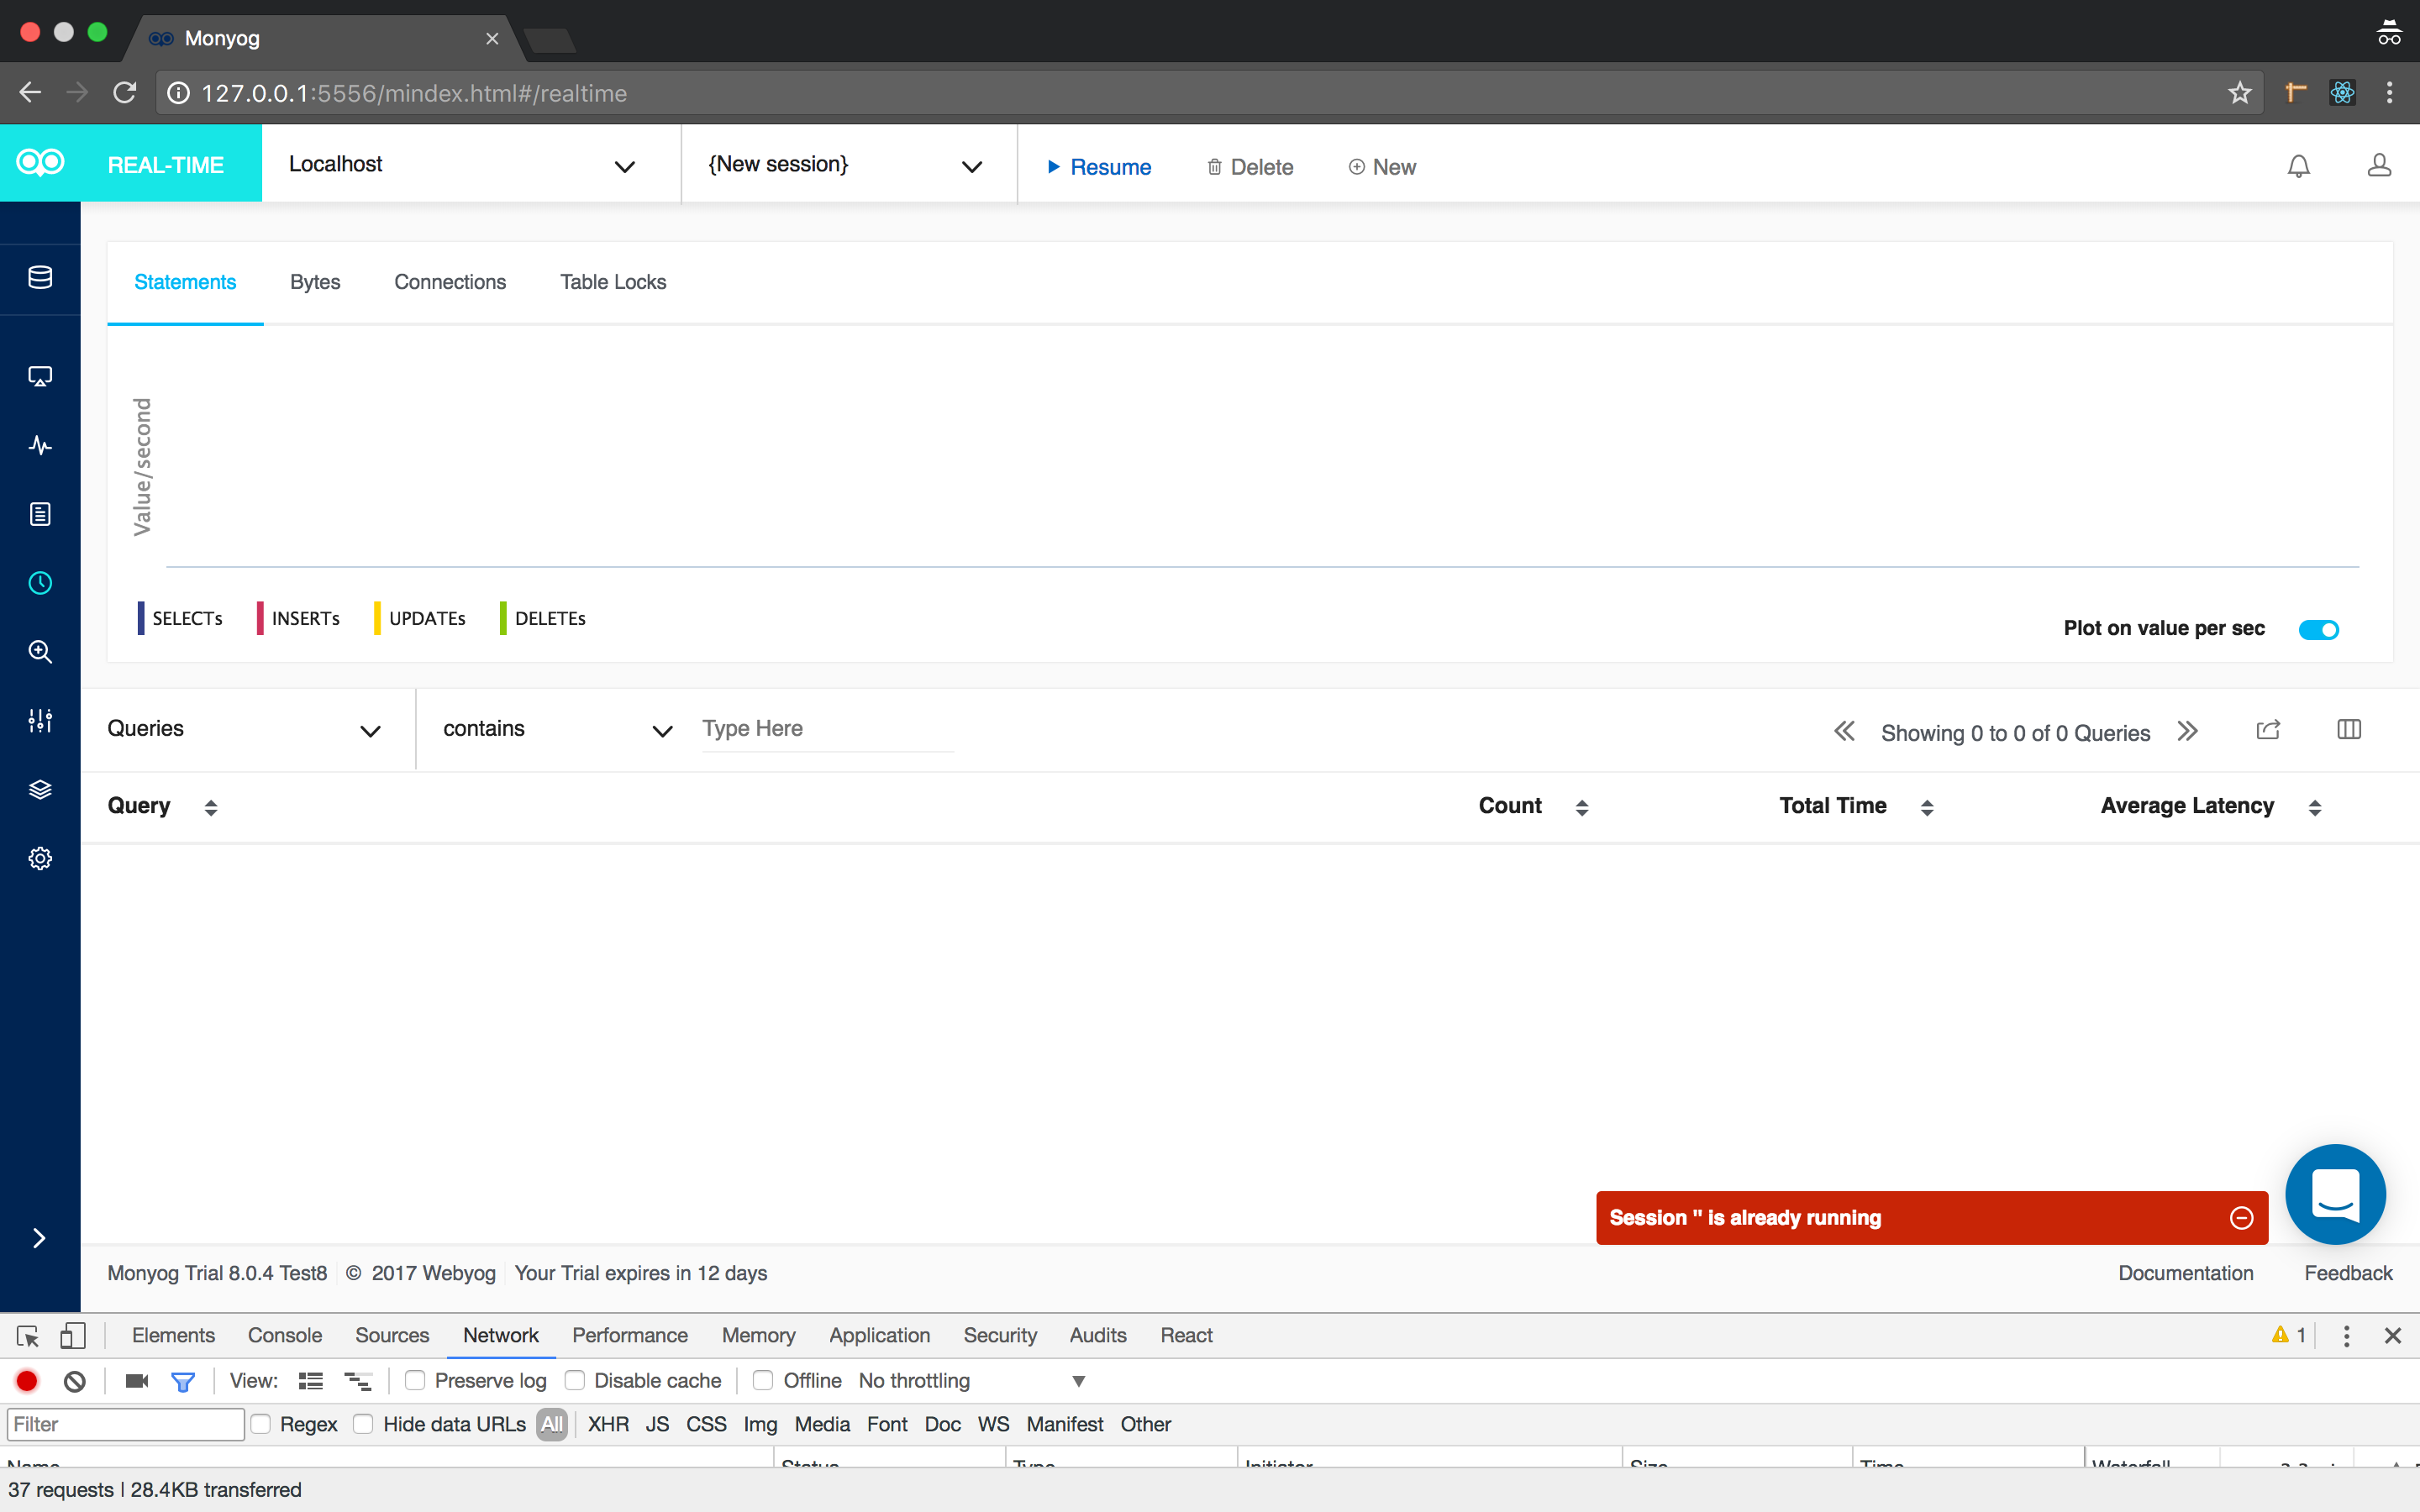
Let’s start with Fiddler, the easy software tool. According to the author of the tool, “Fiddler is a special-purpose proxy server that runs on your Windows, Linux, or Mac computer. Locally-running programs like web browsers, Office applications, and other clients send their HTTP and HTTPS requests to Fiddler, which then (typically) forwards the traffic to a web server. The server’s responses are then returned to Fiddler, which passes the traffic back to the client.”
So Fiddler is used to debug HTTP requests and it has many useful features for that, some described here.
Recently from Visual Studio I was trying to use Source Control Explorer to connect to our project, but I was getting the error TF31002. Before starting to troubleshoot it, my manager, who is a Visual Studio wizard, advised me to run Fiddler.
Within minutes (seconds maybe?), I could see the 502 HTTP error I was getting. With that knowledge, quick research led me to this article that has the solution. Problem fixed!
Tip: The Timeline feature can be used for Performance Analysis. With that, you can easily identify slow requests (long bars).
Tip 2: You can use breakpoints while debugging web requests. They are called requests breakpoints and response breakpoints.
Tip 3: You can collect a Fiddler trace from a server computer, for instance, and debug it on your machine. This is the approach we use for production servers.
Finally, it’s possible to extend Fiddler using the FiddlerScript. I’ve never used this before but the author’s book has a lot of information on how to extend Fiddler’s functionality via its own scripting language.
WinDbg
https://www.bittitan.com/wp-content/uploads/2016/01/R2.png
WinDbg, the hardcore Microsoft debugger, is the #1 software to get to the bottom of complex problems! Not intuitive, not easy to use, but extremely powerful.
You may want to grab a cup of coffee before we start…
As a side note, for a few months when working with Ubuntu, I’ve used GDB and learned LLDB. These are very intuitive debuggers, easy to use and learn. However they don’t come close to WinDbg in terms of integration with the operating system, commands and standard automation capabilities. But, let’s be fair, I love the fact you can use Python to extend GDB.
When working for Microsoft as a PFE (Premier Field Engineer), customers used to ask me a lot about the differences between Visual Studio and WinDbg and when WinDbg should be used, so let’s start with this explanation:
Visual Studio is heavy, but very intuitive, has a lot of features to debug and write code. This is the debugger you want to use when you are programming or when you can debug a problem using your development environment.
WinDbg is very light, but not intuitive. At all. So there is a learning curve but this is the debugger you want to use when:

- You need to do some live debugging on a production server. WinDbg is light and easy to install.
- You want to impress your friends
As you can see, for engineers working with production server problems, WinDbg is the debugger to use. Personally, I like to collect dump files with the software DebugDiag (discussed in my first post <<< hyperlink), use the DebugDiag automated analysis and, if needed, use WinDbg to really dig it deeper.
Now that you know when and why to use WinDbg, let’s continue on how to use it.
WinDbg has a lot of commands, and some of these commands come from extensions. Extensions are DLLs with commands, so you can load them on the fly during your debugging session according to your needs.
Tip: When debugging .NET applications, you need to load the sos.dll extension that is part of the .NET Framework, so you can debug .NET code and see managed code as well as native code. Just use: .cordll -ve -u -l
Tip 2: sosex.dll is another extension that complements sos.dll. They have commands in common but also different commands.
Notice that you can create your own WinDbg extensions or WinDbg scripts. Unfortunately, the WinDbg scripting language is very limited, cryptic, and error-prone, so a simple five-line script can take long hours to be programmed.
Here is an analogy I like to use: someone can learn how to use Wireshark and do some network troubleshooting. It’s definitely useful, however, when you face complex network problems you must know the fundamentals of networking in order to debug the problem. Only knowing how to use the tool is not enough.
WinDbg follows the same principle; if you learn some basic commands even if you don’t understand C/C++, assembly, and some level of OS internals, you still can benefit from the tool. On the other hand, if you face more complex problems, then a deeper understanding of the fundamentals will be necessary as mentioned on item #9 of this blog post.
Tip 3: This is the best book I’ve ever read about .NET performance optimization.
It may come as no surprise that I use WinDbg a lot. This is the ultimate tool when all the other tools are not enough to give us the root cause of some application problem.
Tip 4: This book is about the Sysinternals tools, like Process Explorer, Process Monitor, ProcDump, and the others indispensable tools that are part of Sysinternals.
So if you decide to give WinDbg a try, here are some good resources:
Tip 5: If you don’t use WinDbg all the time, you’ll forget the basic commands. To overcome it, you can have them as hyperlinks as part of the Debugger window, so you just click on the command you want and it runs. Here is how to do the trick.
We use WinDbg for User Mode debugging, but if you need to do Kernel debugging you can learn a lot from these videos.


